Round Analysis

Contents
After an event is imported and summarised into tee times, the player groupings related to each tee time are visible at the top of the screen.
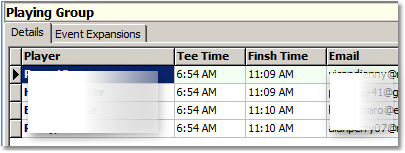
As you scroll through the tee times, the player grouping change to show the currently selected group. It is easy to check who was the first in the group to swipe their card. The earliest swipe is always at the top of the group listing.
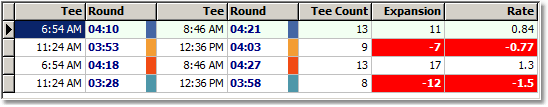
The tee blocks are also summarised as seen above. Each tee block is colour coded and the coding matches the tee block summary below.
Positive expansions are in normal text, negative expansions (tee compressions) are shown in red cells.
In the example above, TeeBlock 1 shows a round time of 4:10 for the first group and 4:21 for the last group in the tee block. That is a total expansion of 11 minutes across 13 tee slots. The expansion rate is therefore 0.84
The second tee block started with around time of 3:53 which is below the policy so this round time is deemed on plicy and the calculation is made from a 4:10 base. Thus a negative 7 minutes was achieved to the last tee time of 4:03 and an expansion rate of -0.77.
The third tee block starts with a round time of 4:18 which is slower than policy and thus a more critical evaluation of the expansion rate is applied. A round time of 4:10 deemed to start results in an expansion of 17 minutes, not 9 minutes and thus a rate of 1.3.
These figures are again summarised in the graph below which shows expansion rates for all tees (colour coded) for the field day currently selected and additionally shows an average expansion rate across all 4 tee block as a bar.
The example below shows a confirmation of the line charts reducing over the final 6 weeks of the graph by virtue of the average expansion reducing from 2.25 on 6.2.13 to zero on 13.3.13.
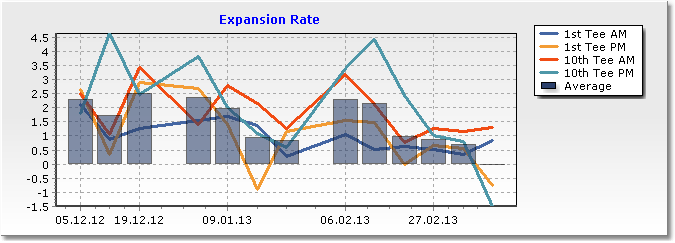
These rates and the graphs are included in the Monthly Expansion Rates Report